The journey of a customer-reported timeout error through developer review, investigation, profiling, and the resulting root cause analysis.
Deciphering the Issue
Over a relatively short period of time, our customer support team had escalated a few “download issues” to JIRA tickets (individually): the short claim was that a few customers were reporting they were unable to download their products after purchase. The tickets were unfortunately bare-bones: mostly a few short words from the support member stating there was a problem with the order’s download and a reference to the case in Salesforce where the supporter was helping the customer. As our team was typically responsible for handling general customer support issues, we created a ‘discovery’ ticket in our backlog to look into these reported issues – validate they were consistent, determine if they were in fact the same issue or separate issues, and find the root cause(s).
What didn’t make sense at first was that the customer support tools were able to view and download these orders without issue and those tools used the same packaging and download process as the customer-facing UI. Reading through the actual exchanges with customers and looking at a screenshot that one customer provided (showing our Cloudflare page for a 504/Gateway Timeout error), it became clear that while the customers’ were complaining about the download, the problem itself was that the order details page was not loading correctly (where the customer could review the completed order and, importantly, download its contents). The discovery ticket was revised with a clearer definition of the actual issue the customers were facing and it brought into our next sprint.
Initial Investigation
Now believing that the tickets were likely to have a common root cause, my first step was to view each order in an attempt to find commonalities. Upon looking at them, one likely candidate was that each order contained a higher-than-average number of SKUs/products.
This problem had only started occurring somewhat recently but it was hard to pinpoint the date as the only details we had were based around customer support requests. Additionally, based on those messages and some testing, it was not specific to new “large” orders, but was also affecting past orders which previously had no issues with their respective “order details” page being loaded.
At this stage, I had a reasonably robust collection of data about the issue:
- It manifested as a timeout (>60 seconds to complete per our configs)
- Common factor(s) included the number of SKUs/products in an order
- It affected past orders that were previously fine in addition to new orders
- Some customers that reported the issue had multiple orders but the issue only affected their “large” orders, not all of their orders
- All affected orders could still be viewed successfully in customer support’s tools
With this information, I decided that my next steps would be to profile the “order details” page that our customers would be taken to after completing an order to see what was going on.
Background About the Site and Codebase
At this point, some additional context about our site and codebase is relevant:
- The main codebase is a PHP-based legacy monolith with roots dating back more than 20 years
- We have a local Docker environment that can be used for most development/feature testing efforts
- We recently updated from PHP5 to PHP7 and the changes to the local environment resulted in Xdebug no longer being enabled for debugging by default
- There are multiple teams/squads working on this site; some devs are using PhpStorm, some Visual Studio Code, and others using their own preferred editors.
Profiling the “Order Details” Page
Looking at available PHP profiling tools, I settled on Xdebug as a first attempt. While our environment no longer had Xdebug automatically set up for debugging, I had previously done work to be able to enable it manually as well as documented how to do so for others (and wrote a ticket for the work to update the environment to simplify the process).
Fortunately, configuring Xdebug for profiling was very similar to what was needed for debugging – just a few config changes and a special way of loading the page. After making and testing these environment changes (and documenting everything for future use by myself and others), I gathered a few sets of profiles of the problem “order details” page: an order with a single SKU, an order with a few SKUs that would still successfully load, and an order with enough SKUs that the timeout error would be triggered.
Analyzing the Results
Now that profiles had been gathered, it was time to analyze the results. I had not been using PhpStorm thus far and I wanted to do things in a way that were repeatable to those also not using PhpStorm so I chose Webgrind and loaded it via its Docker container.
Once I had the profiles loaded in Webgrind, it became trivial to find the issue. Looking at one of the datasets, I could immediately see that more than 85% of the processing time was spent in dozens of SQL queries:
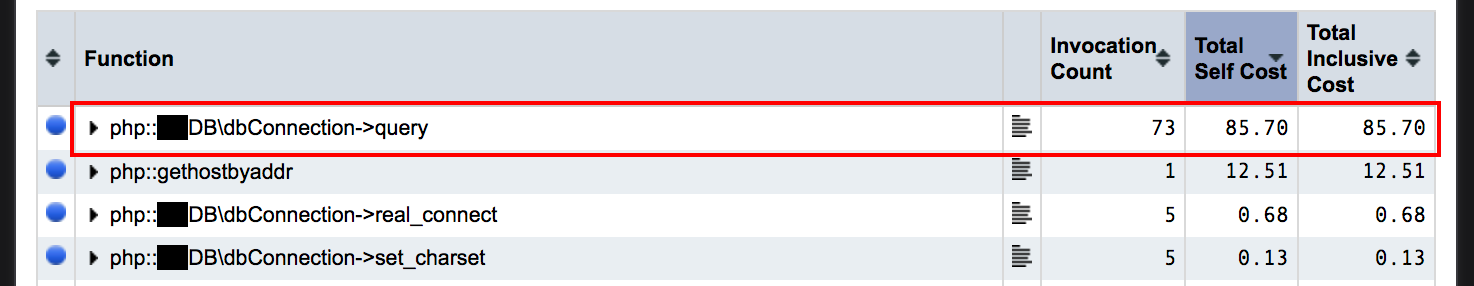
Top view of profiling results showing 85.70% of processing time used by SQL queries
As I narrowed things down, a pattern emerged—there was one particular method making a query which had an execution count matching the number of SKUs in the order which was taking up almost all of the ~85% of SQL queries:
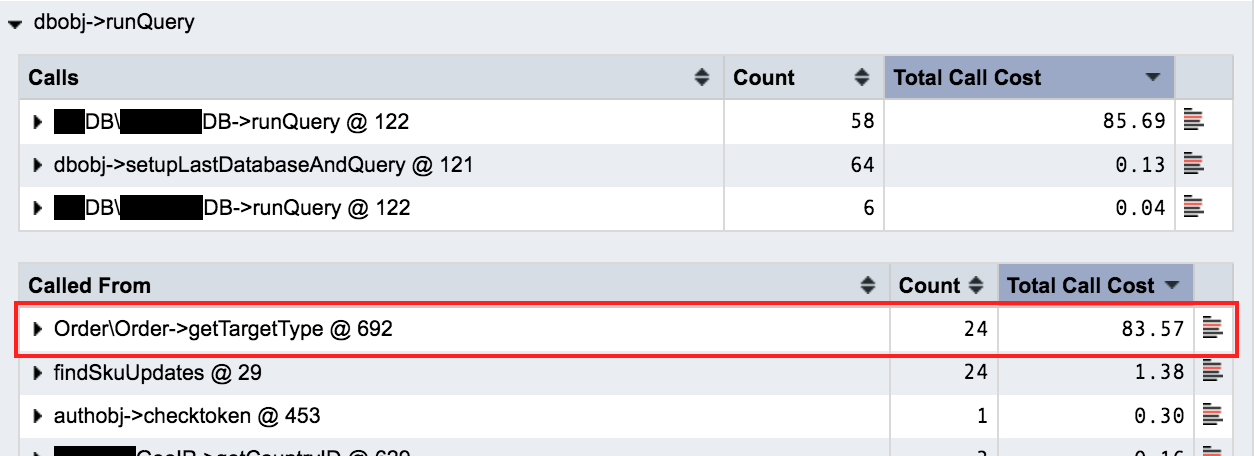
Narrowed view of profiling results revealing a suspicious method
With another click in this view I was able to identify the file and line number where that method was being called:
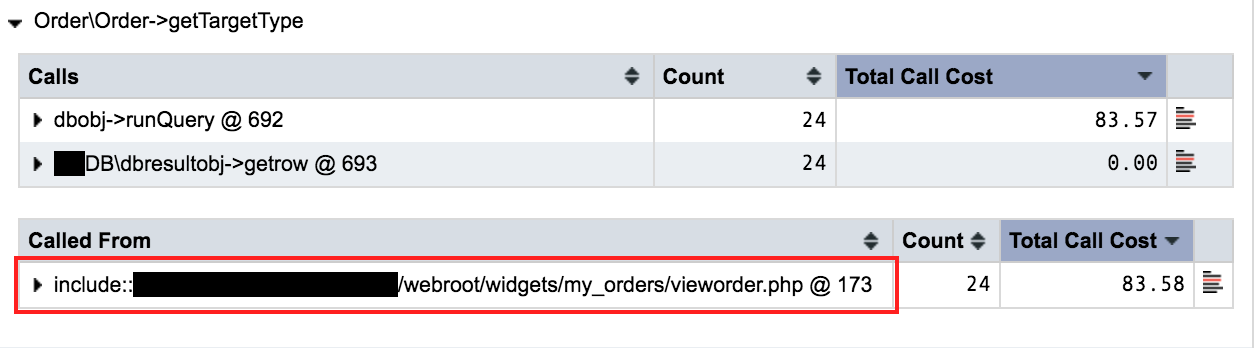
Narrowed view of profiling results revealing the file and line where the suspicious method was being called
Now that I had a precise location, I opened my editor to look more closely at the code and git history. I could see that the method definition and this particular invocation were both added in the last few months. Some brief testing revealed that the query within the method, which looked up data for a single SKU, could take 5+ seconds. As it was executed once for each SKU in the order, any order with around 10-12 SKUs could result in the total processing time exceeding our configured 60-second timeout limit.
Resolution
Over the course of this investigation, I had accumulated various documentation:
- Further details about the issue
- Profiling data from the investigation (with screenshots of relevant ares)
- The problem’s root cause discovered
- Steps required to profile and how to view the profile result data
I was now ready to write the ticket for the work to resolve the issue. This query had been added by a different team and internal politics dictated that the ticket was written in their backlog outlining the issue and its root cause. Fortunately, they were able to take it on in their next sprint and solve it by retrieving the same information the query was providing in a way that was more readily available which, in turn, eliminated the previously added performance/timeout problem.